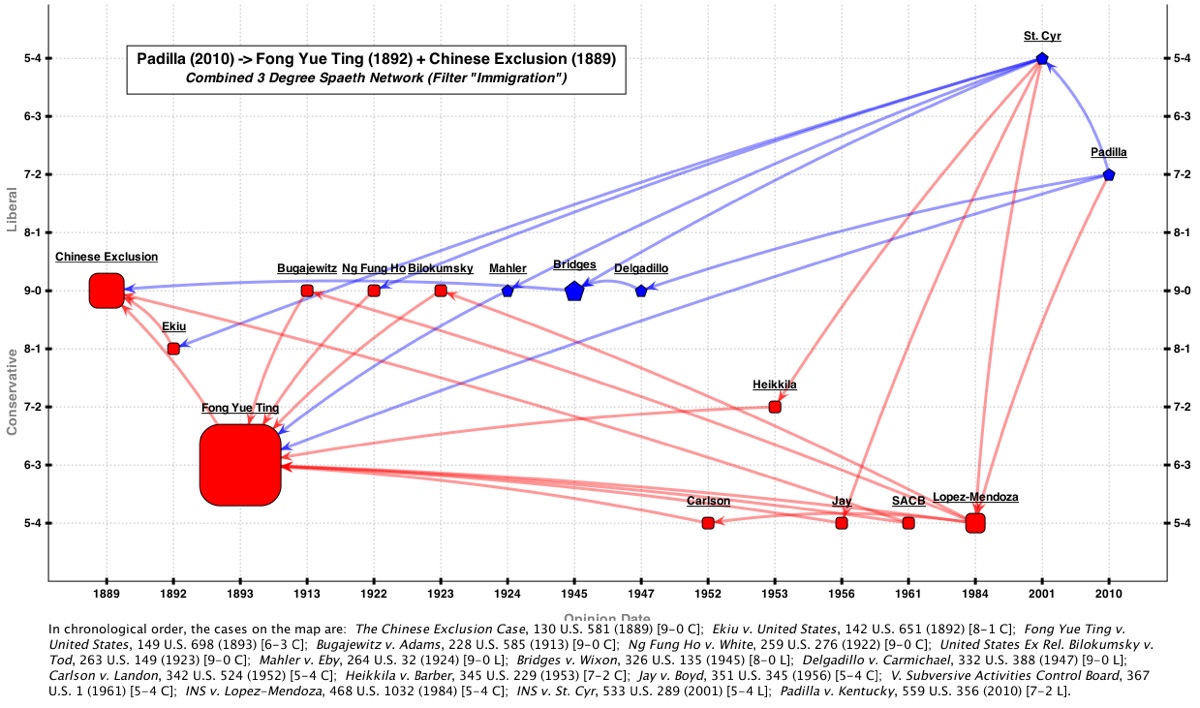
In my last post, I vowed to upgrade a map plotting immigration doctrine to include pre-1946 vote counts and decision directions. The reason the map did not already include this information is that the Spaeth (Supreme Court Database) dataset does not cover cases decided before 1946.
The upgrade process involved examining each case previously plotted in green to figure out two things: (1) the number of votes for and against the majority outcome; and (2) the “direction” of the outcome (liberal or conservative). “Outcome” refers to judgment — who wins or loses. In the usual case, outcome votes will add up to 9. In cases where less than 9 justices actually cast votes, the opinion is plotted based on the number of dissents. (Thus, for example: a 8-0 would be plotted in the same position as a 9-0 and a 5-2 would be plotted in the same position as a 7-2.) Before I explain more, take a peek at the upgraded map (click on it for a full-sized view):
Note that Spaeth’s outcome measurement does not account for subtle hermeneutic distinctions that sometimes arise in fractured decisions. Outcome does not track whether a justice joins part of an opinions but not all. Outcome tracks votes. In the outcome paradigm, the votes of justices who concur “in judgment only” count as part of the majority outcome.
“Decision direction” is a similarly blunt measurement. Under the Spaeth system, direction is either liberal or conservative. While sometimes controversial, the direction code is best thought of as recording who won or lost at the Court. For this map, and following Spaeth for the post-1946 cases, I coded cases where the immigrant/person challenging the government WON relief as “liberal.” On the flip side, when the immigrant LOST, I coded it as “conservative.” This was not always a cut-and-dry process.
Consider 1922’s Ng Fung Ho as just one example. This case involved four Chinese persons challenging their deportations via habeas. Justice Brandeis wrote the unanimous opinion which ultimately allowed two of the individuals to challenge their detention, but denied the other two relief. I coded the opinion conservative because Brandeis offered a very strong view of sovereign power to exclude and was not at all sympathetic to the immigrants’ claims. But because relief was granted, I could have coded the decision liberal.
Such difficult-to-make decisions abound. The best way to avoid them, in my opinion, is to track doctrinal “concepts” rather than “outcomes.” Yet this is a tricky enterprise because it requires a close reading of the cases. Concepts cannot be plotted simply by leveraging the Spaeth dataset. It is a much slower and intensive process — but one that results in more subtle visualizations.
Yet the Spaeth-driven method is still very useful. Though generated quickly, this upgraded map is still quite revealing. For example, it clearly shows a long period of consensus followed by dissent. From 1913’s Bugajewtiz to 1947’s Delgadillo, the Court had nothing but unanimous decisions. Post WWII, we start to see divisions in the doctrine. Though “conservative” cases dominate, “liberal” ones sneak in there too. This is territory worth exploring in more detail. And so I will in the next post!


I tried to use your so-called “Supreme Court Mapper” to find my way to the Supreme Court for an oral argument, and I got totally lost. I guess you’re still working out the bugs.
Dear William:
Alas, this site concerns “doctrinal maps” not oral arguments. You might want to look at the Court’s own site for their oral arguments. Check here: http://www.supremecourt.gov/oral_arguments/oral_arguments.aspx