Most neighborhood-related issues are (seemingly) local–things like real estate development, public amenities, or public services/social development (recreation centers, schools, etc) directly impact the people who live next to or who use the facilities. Residents and elected officials most proximate physically to these kinds of issues tend to voice the greatest concern or support, and without too much contestation, deference is given to their opinions by others not in the immediate surrounding area.
However, the infrastructure systems (transportation, water, energy, etc) of metropolitan areas are, quite literally, the linkages that bind neighborhoods of the region together. Congestion in the road network anywhere will cause backups throughout the system; damming up a water source upstream may cause shortages or flooding downstream; and so on.
The question is whose voice carries the greatest sway in this context? How are “domains” of actors/entities engaged in urban governance organized to produce effective outcomes when everyone will be legitimately impacted, albeit in various ways. And, of course, what are those outcomes?
Bangalore’s Topography and History
To understand the infrastructure systems of Bangalore, it will first help to describe the topology of the region. The city is located 3000 feet above sea level on the Deccan Plateau, which is a landmass that begins to rise in the central part of India towards its highest parts (~3200 feet above see level) in the south. The triangular plateau is flanked by two mountain ranges–the Western Ghats and the Eastern Ghats.
The modern history of the city began in 1537 led by a series of Hindu and Muslim leaders until the city fell to the British (under General Cornwallis–remember him?) in 1791. The area was mostly based on an agricultural economy until a military base was established by the British and, because of the mild climate, became the chosen settlement for other Anglo- and non-Indians.
After Indian independence from the British in 1947, Bangalore slowly increased its manufacturing base. In 1985, Texas Instruments became the first “tech” company to locate in Bangalore and with the economic reforms that began in 1991, several other tech-based firms have followed. Known now as the “Silicon Valley of India” the city’s population has substantially grown from roughly 4 million in the early 1990’s to an estimated 10 million by 2021; the city is currently the 4th largest city in India.
Transportation
In many ways, until the 1990’s economic reforms, Bangalore was mostly envisioned to be a “garden city” for Indian academics and retirees. The exponential population growth over the past 20 years, therefore, is essentially occurring in a city never designed for such a large population. The most obvious result of this potential mismatch is significant road congestion. Based on data for the 2031 Master Plan, in just seven years (2008 to 2015), average journey speeds on the network have declined from 18 kmph to 11kmph. While the city authority operates over 6000 busses a day and has the first two lines of metro completed, personal vehicle use (which includes rickshaws and taxis/UBER) is now a larger share than public transit (52% vs 48%).
According to the Bangalore Mobility Indicators 2011 study that measures key performance measures on congestion, mobility and accessibility, the time delays for private vehicles is near half as much as for public transit users (See Table below).
Travel Time Index = Actual Travel Time/Ideal (free flow) Travel Time
- Average ideal travel time for a ideal speed of 40 Kmph: 13.22 minutes
- Average travel time along the corridors (private vehicles): 22 minutes
- Travel time index (private vehicles): 1.69
- Average travel time along the corridors (Public transport): 35 minutes
- Travel time index (Public transport): 2.38
Source: (Speed and delay survey)
The stated transportation goals of the 2031 Master Plan aims to “…emphasize the pre-eminence of public transport and non-motorized modes of travel” with the goal of having 70% of all trips occurring on public transit.
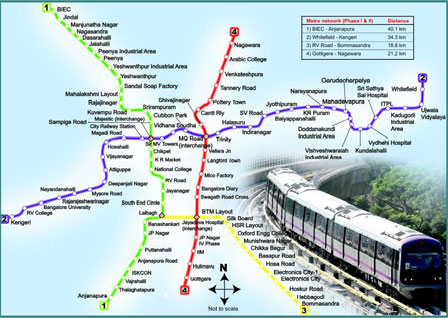
Namma Metro
One way to address the disparity between the private and public mobility has been through the development of the Bangalore (Namma) Metro system. In operation at some level since 2011, Phase 1 of the project was just completed in 2017. There are now two fully functional lines (green and purple) of what will be a system of 4 major routes. Phase II of the network expansion, which includes activities such as budgeting, construction and land acquisition, is currently underway. In July 2017, 280,000 trips were made at the five most popular stations on the Purple Line while the top five Green Line stations saw 143,000 trips.
Namma Metro
[slideshow_deploy id=’56’]
References
- Master Plan for Bangalore 2015 “An Integrated Approach towards a Vibrant International City“
- Database/Information for Preparation of the 2031 Master Plan for Bengaluru (Bangalore)
- Benjamin Solomon–Cities Beyond the Plan (Chapter 7 in Bates, Crispin, and Minoru Mio (eds.) Cities in South Asia. New York, NY : Routledge, Taylor & Francis Group, 2015.