
Throughout the clinic, we have constantly used python to perform data analysis. Usually, the data analysis we performed concerned identifying trends made from other people; rarely ever did we look at our own data trends. With just a few changes, python can allow for us to see our own data trends and visualize trends that have developed over time.
When it comes to implementing these trends outside of strictly data analysis, it can provide us with information that normally would not be taken into account. For instance, trial lawyers, who are required to keep accurate time information, trends can show what actually takes up a lawyer’s time. Do lawyers spend more time at the beginning of a case or closer to the end? Do they increase the time spent during trial times or is there a steady increase leading up to the trail? These are questions that lawyers usually face and would rarely be able to give an accurate answer. One lawyer might say they work very little on a case until the trial date is closer, while another lawyer would claim that they use a steady increase in order to work on more cases and have everything prepared before the trial starts. Which method is best? Well, that would solely depend on the lawyer and data analysis would not be able to tell which method is better.
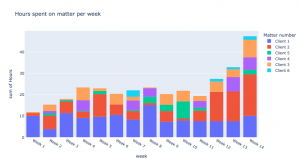
While each firm has its own software to keep track of time spent, this clinic used Clio. Throughout the clinic, each member has entered in their own time throughout the week; some did it immediately after completing clinic work while others did it at the end of the week. However, interesting trends developed from how the hours were spent throughout our time in the clinic. In my case, it can be seen that as the weeks went on, the amount of hours spent doing clinic work increased. Most of the time it hovered around the low twenty hour mark and as the clinic came closer to ending, the average ended up being closer to the thirty hour mark.1
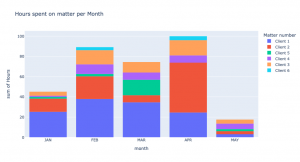
It also showed an interesting factor that was not considered originally. For instance, mid-way through April it was discovered that February had almost ten more hours than any of the other months. While this would seem like a discrepancy, it made sense because the clinic took a week off in March, which explains the difference.
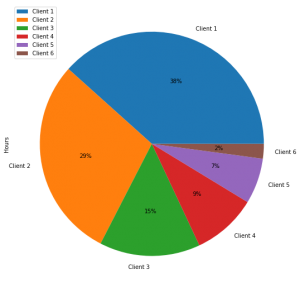
Throughout the clinic we had a total of six clients. Using python, we can see which client we spent the most time on. Each member was lead on a different client, but because each client work was different, in certain cases a team member might have done more work on a different client than the one they were lead on. 3 In this example my percentage of hours for the client does not reflect which client I was lead on.
Overall, using python to view different trends that happened throughout this clinic experience has shown interesting patterns. It helped remind us that all clients are not the same, and each person will work at their own pace. Viewing trends over a long period of time can help give the user a greater insight into their own work habits, which allows the user to adjust their habits or lean into them.
1Photo of Hours Spent per Week
2Photo of Hours Spent per Month
3Photo of percent of Hours spent per client
