A correlation requires at least 2 continuous variables. We need to first define our variables in Variable View. In this case, we’re looking at how number of absences relates to grade point average.

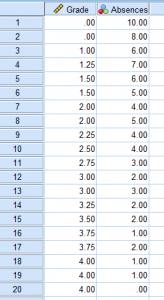
Next, we type in our data points in Data View.
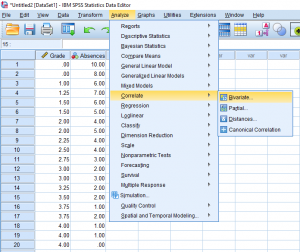
To run the analysis, go to Analyze > Correlate > Bivariate.
A pop-up should appear. Put both of your variables in the Variables column.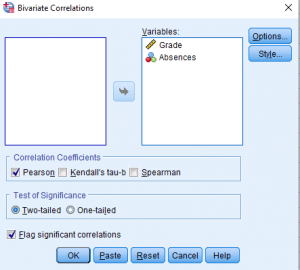
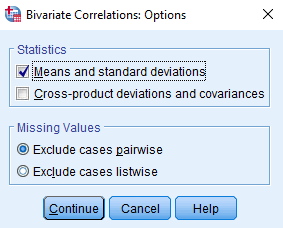
Then, go to options and click means and standard deviations if that is something you need to report.
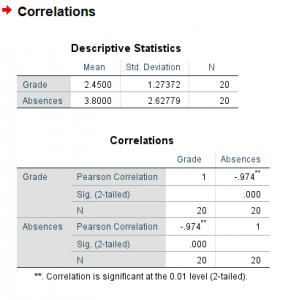
Your output should look something like this. The correlations matrix looks a little redundant, but what’s important here is the Pearson Correlation value and the significance. You should have everything you need here to report a correlation. For information about how to do a scatter plot, please visit the SPSS Regression post.