Some Statistics Basics!
Whether this is your first statistics class or whether you’re just in need of a refresher, there are a few basic statistical principles which are necessary for one to understand before moving forward.
Understanding Populations and Samples
Populations are the groups of people that we are interested in studying. This can be the entirety of people with depression, an entire town, or dog-owners. Populations can vary in size but are typically very large. They are almost always impossible to study in their entirety. Therefore, we select samples from a population. Although they’re never as diverse as the population, they are generally representative. However, they provide limited information and introduce sampling error.
Samples are a subset of the population which as been selected by various means. A sample is representative when it accounts for the variability and diversity of the population. For example, a representative sample of “individuals who attend the University of Baltimore” would include a diversity of age groups, race, educational background, students from different programs, faculty from multiple departments, staff, etc., in their appropriate percentages in the population. A non-representative sample in that case would not account for the various differences that exist among the individuals in a population, or would over-represent/under-represent a specific group. The figure below illustrates a hypothetical population, two examples of non-representative samples, and one representative sample of that population.
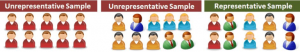
Source of Figure: https://www.fieldboom.com/representative-sample
Why do we care about these distinctions? What we really care about is getting an answer that most closely represents a population. A non-representative sample introduces bias and error, and precludes researchers from making sound interpretations. But since we can’t study entire populations, we want to take samples and study them as best as we can to generalize the results to the population. Samples are not going to be exactly representative of a population so it’s best to know the distinction.
Why can’t researchers study entire populations? As we mentioned before, populations are usually extremely large, and it would require a lot of time and resources (e.g. financial resources) to study it in its entirety. Furthermore, in a hypothetical world where a researcher possesses the resources necessary to do so, they will not be able to include every single person from the population in their research study.
Parameters vs Statistics and Sampling Error
A parameter is a value that describes a population, while a statistic is a value that describes a sample. A good way to remember it is: Parameter – Population, Statistic – Sample. If the sample was a good enough sample (completely random and preferably large), then these values should be very similar. Sampling error is the discrepancy that exists between a sample statistic and the corresponding population parameter. Every sample will have sampling error simply because a sample cannot possibly be as diverse as a whole population, but there are measures of preventing a larger one.
How do these things relate to one another? These things all relate to each other because we select participants from a population which become a sample, on which we run tests and analysis, and then we can determine if the results are then generalizable to the general population we’re studying.
Sampling Methods
There are a number of ways to collect sample data. There are pros and cons to each, but simple random sampling reduces sampling error the most.
- Simple Random Sampling:
- Everyone has an equal chance of being selected.
- The selection method is completely random.
- One individual’s selection does not impact the likelihood that someone else is subsequently selected.
- Systematic Sampling:
- In a lost of all the individual, every nth individual is picked.
- Convenience Sample:
- Using the first individuals a surveyor comes across for the sample.
- Lease likely to get a representative sample.
- Cluster Sampling:
- Dividing the population into groups (usually geographically).
- The clusters themselves are randomly selected while the people in them are not.
- Stratified Sampling:
- Divides the population into groups based on characteristics.
- A sample is taken from each of these groups so that characteristics that are important are accounted for.
Variable Types and Individuals
A variable is a characteristic or condition that changes or has different values for individuals. In other words, it’s something that can be manipulated, categorized, or measured. An independent variable is a variable that is manipulated or decided on by the researcher. A dependent variable is a variable which is not to be manipulated, but instead observed. For example, if one is trying to see whether plants grow faster depending on the type of fertilizer is used, then the independent variable is the type of fertilizer and the dependent variable is the growth of the plant.
A categorical variable is a variable which is measured by its name or category. This could be color (red, green, blue, etc.), gender (man, woman, nonbinary, etc.), or in the case of our coffee example, whether the coffee is meant to be served hot or cold. Although we might assign each of these categories a number in SPSS or excel, these numbers have no quantitative value and are just replacements for the names. Here is a link to a Khan Academy video which may be helpful to you in understanding this concept.
An individual is an object or person that is described by a set of data. So if we were measuring the height and weight of 15 participants, each of those participants would be an individual in the study. If we were looking at the different coffees on a menu and we gathered data on whether each drink is hot or cold, how many calories is in each drink, how much sugar is in each drink, and how much caffeine is in each drink, then each of the different kinds of coffee would be considered individuals in this study.
Types of Statistics & Types of Studies
Descriptive statistics are used to summarize, organize, and simplify data (basically it lets us turn data sets into something legible). Inferential statistics are techniques that allow us to make generalizations about the population from a sample (so this is actually comparing groups to see if there are statistical differences between them or comparing variables to see if there are relationships between them). There are two types of data structures that make use of these kinds of statistics.
Data Structure I: Measuring two variables for each individual
Correlational method: Measuring two variables for each individual in order to determine if there is a significant relationship between the two. A limitation of this method is that it can show a relationship, but not an explanation for the relationship. A correlation does not necessarily mean a causation and is never enough to draw such an inference.
Data Structure II: Comparing two or more groups of scores
Experimental Method: The goal is to demonstrate a cause and effect relationship between two variables. The experiment attempts to show that changing the value of one variable causes changes to occur in the second variable. This requires:
- Manipulation: The researcher manipulates one variable by changing its value from one level to another. A second variable is observed to determine whether the manipulation causes changes to occur
- Control: The researcher must exercise control over the research situation to ensure that other, extraneous variables do not influence the relationship being examined. These variables that need to be controlled can be participant variables (characteristics such as age, gender, and intelligence that vary from one individual to the other) or environmental variables (lighting, time of day, weather, etc.). Researchers should control for as many variables as they can, and so spend a lot of time designing an experiment about what variables are important to control for and how to go about doing that.
Non-experimental Method (Nonequivalent groups and pre-post studies): This is when the experimenter is unable to fully manipulate the independent variable. For example, when gender is studied, one can’t assign participants to be a random gender. Researchers also have no control over time, and so pre-post tests are also not true experiments. What is meant by this is that a variable is measured twice (pre and post), and researchers can’t control which they measure first – it must be the pre.
Constructs
Constructs are internal attributes or characteristics that can’t be directly observed but are useful for describing and explaining behavior. The construct is a proposed attribute of a person that often cannot be measured directly, but can be assessed using a number of indicators or manifest variables (for example, depression). We tend to use an operational definition for constructs, which describe a set of operations for measuring the construct and defines a construct in terms of the resulting measurement. Here is a helpful YouTube link for explaining this concept.
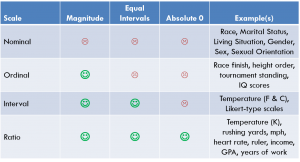
Scale Types
A scale is a way in which to categorize and/or quantify variables. Each type of scale may have a combination of magnitude, equal intervals, absolute 0, or none. Magnitude means that the scale specifies if each marker has relative value to the other markers. Equal intervals means that a one point difference carries the same weight throughout the scale and that there is a linear relationship among the variables. Absolute 0 just means that the 0 on the scale means the complete absence of that thing. The different types of scales are as follows:
- Nominal: Set of categories; no quantitative distinction (Ravens, Steelers, etc.)
- Ordinal: Categories in an ordered sequence ( 1st place vs. 4th place. We don’t know the differences between each race time, only that this is the order that they came in.)
- Interval: Ordered categories with equal intervals. Arbitrary zero point (ex. Celsius, 0 could have been placed anywhere but we decided to place it at the freezing point of water)
- Ratio: Ordered categories with equal intervals. Absolute zero point. (ex. Height or weight)