
Introduction to Correlation and Regression
So far we’ve been talking about analyses which involve variables which are split up into categorical or discrete variables (ex. treatment A, B, C) compared to a dependent variable which is continuous (ex. plant height). However, there is a way to look at two variables which have continuous data: correlation. A correlation will tell you the characteristics of a relationship such as direction (either positive or negative), form (we often work with linear relationships), and strength of the relationship. Strength and direction can be understood with the number which is given at the end of an analysis (r).
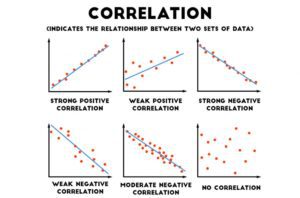
A positive correlation is one in which the increased value of one variable results in the increased value of another. For example, height and weight – as height increased, weight also tends to increase. A negative correlation is one in which the increased value of one variable results in the decrease of another. For example, as the temperature outside increases, hot chocolate sales will decrease. This is what is meant by the direction of a correlation. An r-value with a negative sign in front of it means a negative correlation and one without a negative sign means a positive correlation.
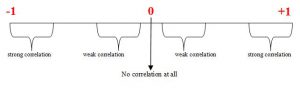
R-values exist on a plane between -1 and 1. The closer a number is to 1, the stronger its positive relationship. The closer a number is to -1, the stronger its negative relationship. The closer a number is to 0, the weaker its relationship, no matter if its negative or positive.
Pearson Correlation
The most common type of correlation used is the Pearson Correlation. It measures the degree and direction of the linear relationship between two variables. It will measure a perfect linear relationship. Every change in variable X has a corresponding change in variable Y. The possible range of an r-value is between -1 and 1. R is calculated in the following way: r = covariability / variability of X and Y separately.
There are some important factors to take into consideration when using and interpreting the Pearson Correlation.
- Correlation does not demonstrate causation. This is something very important to remember; just because two variables have a correlation doesn’t mean that one is causing the other. There may be another factor (Z) that we haven’t measured which may be the real reason. Take into account that when ice cream sales go up, so do the number of drownings in an area. Does that mean that ice creams are causing people to drown? Consider that maybe increased temperatures result in more ice cream consumption as well as an increase in the number of people who are going out swimming. You can never know if there’s a third lingering factor with just a correlation.
- The value of the correlation is affected by the range of scores in the data. For example, if you’re looking at how height and age correlate, if your sample is just made up of people who are 20 or older, you probably will get a weak correlation, as most adults no longer grow. However, if your sample is 17 or younger, you’re likely to find a decent positive correlation.
- Extreme points (outliers) have an impact. Data points which vary greatly from the others may sometimes need to be removed as their presence affects the correlation.
- Correlation cannot be interpreted as a proportion.
Coefficient of Determination
The coefficient of determination is a measurement of the proportion of variability in one variable that can be determined from the relationship with the other variable (r squared). In other words, it’s used to analyze how differences in one variable can be explained by a difference in a second variable. The example given by Statistics How To is that when you get pregnant has a direct relation to when they give birth. Link to the whole article here. This measure is usually reported along the lines of this: “75% of the variation in Y can be explained by the variation in X.”
Other Types of Correlation
While Pearson Correlation is the most commonly used, there are times when the data one collects warrants the use of a different kind of correlation. Some are listed below:
- Partial Correlation: A partial correlation measures the relationship between two variables while controlling the influence of a third variable by holding it constant.
- Spearman correlation: Used when both variables are measured on an ordinal scale; Used when the relationship is consistently directional but may not be linear.
- Point-biserial correlation: Measures relationship between two variables when one variable has only two values (dichotomous value)
- Phi-coefficient: Both variables are dichotomous. Both variables are re-coded to values 0 and 1