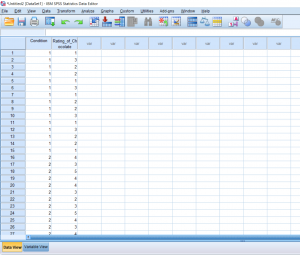
So far we’ve talked about creating independent variables, but what about levels? This may seem strange at first, but levels of a condition need to be spelled out by numbers. Usually, I just assign condition 1 a 1 and condition 2 a 2. You can see in the picture below how this looks. You can’t see this, but there are 30 individuals in total, half in condition 1, and half in condition 2.
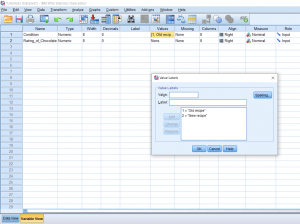
For this tutorial, we’ll pretend that this data has been collected by a struggling baker who wants to try out a new cookie recipe to see if customers would like it better. She asks 15 people to sample her old recipe and 15 people to sample her new recipe and rate how they liked the cookie on a scale of 1-5. To make this easier to read in the output later, I’m going to label the conditions in Variable View.
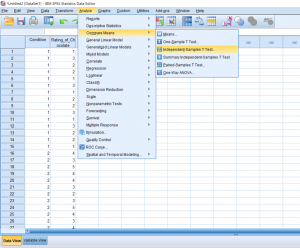
Now it’s time for the actual analysis. Click the Analyze button, hover over Compare Means, and click Independent Samples T-Test.
A pop-up will appear. Put your dependent variable in the Testing Variable box and your conditions in the Grouping Variable box. Then, click the Define Groups button. 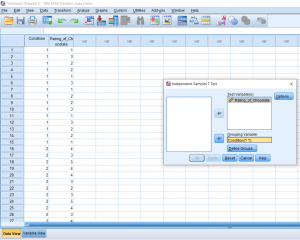
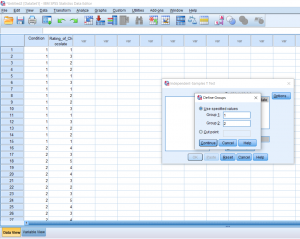
Another pop-up will appear. Simply fill in each box with the number that corresponds to your groups (again, in my case it’s just 1 and 2).
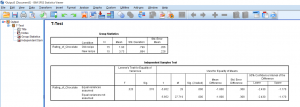
Your output will look something like this. The first row of boxes will simply give you descriptives about your data. The second box get’s a little tricker. The boxes under Levene’s Test for Equality of Variances simply allows the user to see if the two samples have equal variances. In this case, we want the p-value to be less than .05 because we don’t want any differences in the variances. It looks like we’re in the clear for this data set. The next few boxes give us the t-statistic, the degrees of freedom, and the p-value. It looks like our conditions are significantly different. Remember to report a .000 p-value as p<0.01, because there is no such thing as a p-value of 0. So we know that there’s a difference, but which cookie got the higher score overall? Simply look at the means. The new recipe has a higher mean rating than the old recipe.