Evaluating Normalcy
Many statistical tests run on the assumption that the data with which you are working is normally distributed, so it’s important to check. There are several different ways to go about this,. This post will explain a few different methods for testing normalcy as well as provide some instructions about how to run these tests in Excel.
Mean vs. Median
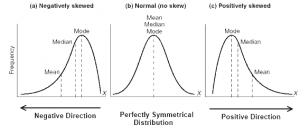
An important rule to note about distribution is that in a normal distribution, the mean, median, and mode are approximately equal. What it looks like visually is that the mean, median, and mode are all sitting at the top of the hump of the bell curve. When a distribution is skewed, these values become different. The mode will always sit around the hump of a distribution (because this is where most of the values have accumulated). The mean is the measure of central tendency most affected by extreme variables and outliers, so it will follow the longest tail. The median, in this case, will always fall somewhere between the median and the mode. Put another way, if the distribution is positively skewed, the mean will be the greatest value, the median will be the second greatest value, and the mode will be the smallest value. If the distribution is negatively skewed, the mean will be the smallest value, the median will be the second smallest value, and the mode will be the greatest value. So when you’re looking at a data set, you may be able to get an idea of the skew of the distribution by comparing the mean and the median.