
Independent One-way ANOVA
An ANOVA (ANalysis Of VAriance) is a test that is run either to compare multiple independent variables with two or more levels each, or one independent variable with more than 2 levels. You can technically also run an ANOVA in the same cases you would run a t-test and come up with the same results, but this isn’t common practice, as t-tests are easier to compute by hand.
For the purposes of this post, a One-way ANOVA is a test which compares the means of multiple samples (more than 2) which are connected by the same independent variable. An example of this might be comparing the growth of plans who receive no water (Group 1) a little water (Group 2), a moderate amount of water (Group 3), and a lot of water (Group 4).
A factor is another name for an independent variable. As mentioned earlier, ANOVAs can sometimes have more than one factor, but for now we’re only working with one, just like we have before. A level is a group within that independent variable. Using the example from before, the groups in which the plants are put in are the levels (no water, little water, some water, a lot of water) and the independent variable itself is just water amount.
Experiment-wise Alpha
A question you might be asking yourself is, why bother doing an ANOVA when I can just do multiple t-tests? This is because the risk of a Type I error that accumulates as you do more and more separate tests. Doing multiple t-tests would result in greater experiment-wise alpha and therefore experiment-wise error. In a lot of ways its better to just do one big ANOVA to look for differences and then decipher those differences later using a post-hoc, which will be discussed later.
Hypothesis Testing with One-way ANOVAs
The null and alternative hypotheses for a one-way ANOVA are as follows (please keep in mind that 3 is not the maximum number of means that can be compared so write your hypotheses accordingly):
H0 : µ1 = µ2 = µ3
H1: µ1 ≠ µ2 ≠ µ3
Essentially, the point is whether there will or won’t be a significant difference between the groups, or at least two of them.
Steps for calculating a one-way ANOVA (please refer to the statistics formula glossary for actual formulas):
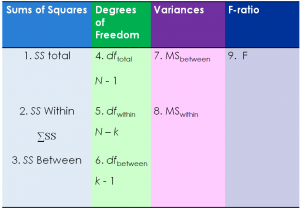
Variability in One-Way ANOVAs
There are multiple kinds of variability found within the calculation of an ANOVA. There is between-treatment variance and within-treatment variance. The between-treatment variance can be further broken down into systematic treatment effects and random, unsystematic factors. The within-treatment variance only accounts for random, unsystematic factors in this case.
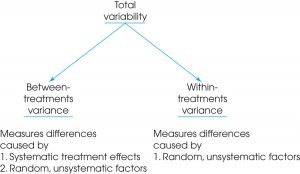
The purpose of calculating within-treatments variance is to determine how much of the between-treatment variance was due to random, unsystematic factors and how much was due to treatment effects.
There is a conceptual meaning underlying the ANOVA formula. The numerator is meant to represent the differences between sample means and the denominator is meant to represent the differences between samples expected with no treatment effect. This is basically between-treatments variance (the general differences between treatment conditions) and within-treatment variance (the variability within each sample).
Assumptions of a one-way ANOVA
- The observations within each sample must be independent.
- The population from which the samples are selected must be normal.
- The populations from which the samples are selected must have equal variance (homogeneity of variance).
Effect Size in One-Way ANOVAs
Effect size is now calculated with something called partial eta squared. The formula for this is: η2 = SSbetweentreatments / SStotal, or the sum of squares of the between treatments over the sum of squares total.
Post-Hoc Test
A post-hoc test allows one to figure out which groups are significantly different from one another once a significant F-ratio has been established. This is better than just running individual t-tests because post hoc still reduce experiment-wise error. There are several options for conducting a post-hoc, but two more popular options are Tukey’s and Scheffe’s tests. Tukey’s test calculates a single value that determines the minimum difference between treatment means that is necessary for significance. Scheffe’s test uses an F-ratio to evaluate the significance of the difference between the two treatment conditions. Formulas for both of these tests are in the statistics formula glossary.