
When getting started with SPSS, you may initially be confused about how to input your data in such a way that it’s easy to read and will allow you do to do the analyses that you would like to do.
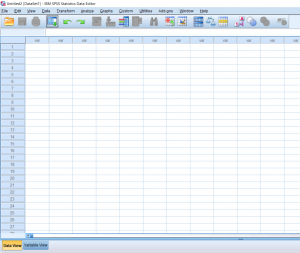
When first opening a new dataset on SPSS, you will be greeted with this blank screen on the Data View tab.
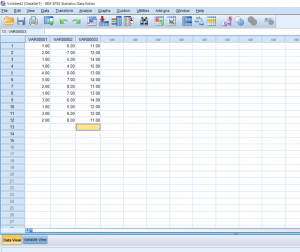
The Data View tab is where you will be inputting the actual data. The way the data should be organized is that all data corresponding to a variable is lined up by column. Data for more than one variable which corresponds to an individual should be organized by row. The picture shows data for three variables organized by column.
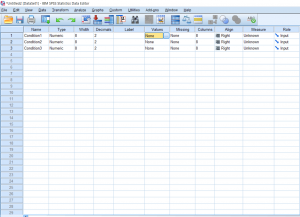
But I want to know what it is I’m looking at; which column corresponds to which variable? This is when you would click on the Variable view tab to name your variables. All you have to do is click on the variable you want to rename and type in the name like an Excel spreadsheet.
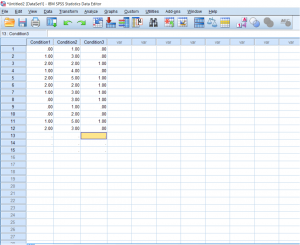
If you’re working with interval or ratio variables, skip this next step, but because I want to try working with nominal variables, I’m going to reenter my data on the Data View so that my condition 1 is full of only 0’s, 1’s, and 2’s. I want to make my condition 2 full of only 1’s, 2’s, 3’s, 4’s, and 5’s. Finally, I want my condition 3 to be full of 0’s and 1’s. This is because I want each number to relate back to a certain response. I want my condition 1 to be the answer to the question “Do you study for tests?” with the possible answers being “No,” “Sometimes,” and “Yes.” I want my condition 2 to be participant letter grades: A, B, C, D, and E. Finally, I want my condition 3 data to the question “Do you, on average, get 8 hours of sleep a night?” with the answers being “Yes” and “No.” Again, if you’re working with data which is not nominal or categorical, don’t bother with labeling.
In order to make this easier to understand when I’m actually analyzing the data, I’m going to name each of these numbers using the Values section which is highlighted in the Variable View picture two pictures up. Simply double click it to make the blue button appear and click the blue button for a pop-up to appear.
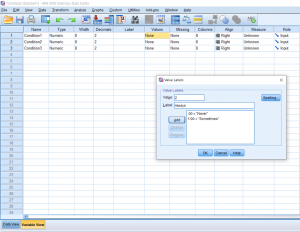
To name a number, simply type the value into the Input box, type the name you would like to give it into the Label box, and click the Add button. When you’re done naming all of your numbers, you can hit the OK button. We won’t be going over what good this does in this post, but it will be important for reading your output data later on, which will be discussed in other posts.
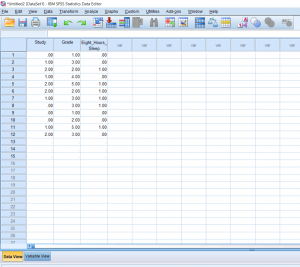
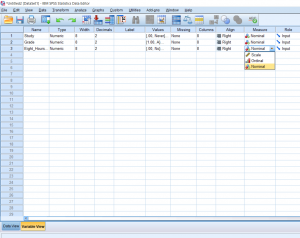
Going back to the Data View, as you can see, changing the names of your data digits does not affect the Data View. I also went ahead and changed the names of the variables in Variable View so that the data have some more context. There are some other things in Variable View which may be important to consider moving forward. Like I said, we’re working with nominal values and SPSS gives us the option of defining them as such for analysis purposes. All you have to do is go back to Variable View, click the button under Measure which corresponds with the variable you would like to change the scale for, and select what you would like from the drop-down menu.
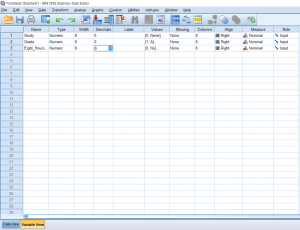
Finally, when I’m working with whole numbers, I find the two decimals at the end of each number to be rather annoying. To get rid of those, just click the box you want to change under Decimals and change the number of decimals you would like to see next to each number in that variable column.
These are all the basics of inputting data. It is possible to copy and paste Excel data into SPSS if you already have a data set ready. Please just keep in mind that unlike working in Excel, variable names cannot simply be put in the first rows of the sheet, they must be logged in Variable View.