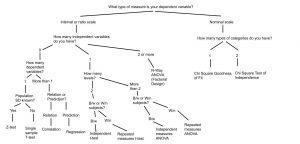
The following post is about breaking down the uses for different types of tests. More importantly, it’s designed to help you know what test to use based on the question being asked. This is not a comprehensive list of all the statistical tests out there, so if you feel that there is something missing which you would like to be included, please leave a comment below. All formulas for the tests presented here can be found in the Statistics Formula Glossary post. At the bottom is a decision tree which may be helpful in visualizing the purpose of this post.
Tests Involving Means
Z-Tests
- Manipulated variables (IV): 0
- Measured variables (DV): 1
- Population Standard Deviation Known?: Yes
This is a type of single sample comparison of means. It is important that there is one sample, the population mean is known, and – for a z test specifically – that the population standard deviation is known.
Example word problem:
The price of gas is normally distributed across the country, μ = 2.60, σ = .42. You want to know if our prices here in Johnstown are significantly different from the population. The mean price of 40 gas stations in Johnstown is 2.29. Is the price of gas in Johnstown significantly different from the national gas price?*
*http://www.pitt.edu/~bertsch/Z%20test%20practice.pdf
Single sample t-test
- Manipulated variables (IV): 0
- Measured variables (DV): 1
- Population Standard Deviation Known?: No
It is important that there is one sample, the population mean is known, and – for a t-test – that the population standard deviation is unknown.
Example word problem:
A coffee shop relocates to Italy and wants to make sure that all lattes are consistent. They believe that each latte has an average of 4 oz of espresso. If this is not the case, they must increase or decrease the amount. A random sample of 25 lattes shows a mean of 4.6 oz of espresso and a standard deviation of .22 oz.*
Remember, we’re still working with a sample mean, so we need standard error. However, we don’t have the population standard deviation, so we calculate the estimated standard error.
*http://www.mathandstatistics.com/learn-stats/hypothesis-testing/one-sample-t-test-hypothesis-test-by-hand
Independent Samples t-test
- Manipulated variables (IV): 1
- Number of levels: 2
- Measured variables (DV): 1
- Independent samples vs repeated or matched participants: Independent
In this case, we’re no longer working with a population mean. Instead, we’re looking at the differences between two samples. Each sample represents a different level for the same manipulated (or independent) variable. If you’re unsure of whether to use a pooled-variances t-test or separate variances t-test, it would be important to first run an F-test to check for homogeneity of variance. If you run the F-test and the results show that the p-value is greater than your level of significance (in other words, you fail to reject the null hypothesis), that means your variances are not significantly different and you should use the pooled-variances t-test. If the F-test shows a p-value less than your level of significance (in other words, you reject the null hypothesis), that means your variances are significantly different, you do not have homogeneity, and you should use a separate variances t-test. They are both types of independent t-tests, though, and so a word problem for each may look the same.
Example word problem:
Let’s say you’re curious about whether New Yorkers and Kansans spend a different amount of money per month on movies. It’s impractical to ask every New Yorker and Kansan about their movie spending, so instead you ask a sample of each—maybe 300 New Yorkers and 300 Kansans—and the averages are $14 and $18. Is there a significant statistical difference between the two samples?*
*http://docs.statwing.com/examples-and-definitions/t-test/
Repeated Measures or Matched Pairs t-test
- Manipulated variables (IV): 1
- Number of levels: 2
- Measured variables (DV): 1
- Independent samples vs repeated or matched participants: Repeated
Just like with the independent samples t-test, we’re comparing the means of two different samples which represent two different levels of an independent variable. The difference here is that these samples are somehow related, either because they use the same participants or because the participants are matched together in some way.
Example word problem:
Researchers were interested in whether a new depression medication could increase mood. Participants’ moods were measured on a standard PHQ-9 scale (in which a greater score means more severe depression) before taking the drug and the average score was 14 with a standard deviation of 2. After 6 weeks of taking the new drug, the same participants filled out the PHQ-9 again and the new average score was an 11 with a standard deviation of 2.2. Was there a significant difference in the PHQ-9 scores before and after treatment?
Independent One-Way ANOVA
- Manipulated variables (IV): 1
- Number of levels: More than 2; In this case 3
- Measured variables (DV): 1
- Independent samples vs repeated or matched participants: Independent
Now, instead of comparing two samples which represent two levels of an independent variable, we’re working with more than two. However, we are still working with one independent variable.
Example word problem:
The owner of a plant nursery wanted to know which fertilizer type to recommend to her customers in order to help their azaleas produce more flowers. She decided she wanted to test chemical fertilizer, composted fertilizer, and manure. She tested 10 different azalea plants per condition…
Repeated Measures One-Way ANOVA
- Manipulated variables (IV): 1
- Number of levels: More than 2; In this case 4
- Measured variables (DV): 1
- Independent samples vs repeated or matched participants: Repeated
This is the same idea as the independent one-way ANOVA except that, just like with the repeated measures t-test, the samples are somehow related to one another.
Example word problem:
Researchers were interested in seeing how the season affects overall mood in those who are not necessarily diagnosed with depression, dysthymia, or seasonal affective disorder. Participants were each asked to fill out a PHQ-9 once in the fall, once in the winter, once in the spring, and one final time in the summer.
Two-Factor (or N-Way) ANOVA
- Manipulated variables (IV): More than 1; in this case 2
- Number of levels for IV1: 2
- Number of levels for IV2: 3
- Measured variables (DV): 1
Example word problem:
The plant nursery owner decided she wanted to change her experiment. Not only was she curious about fertilizer type, but she was wondering if maybe the amount of water she gives to her azaleas affects the bloom. She kept her original three fertilizers (chemical fertilizer, composted fertilizer, and manure), but she also gave half of the plants in each condition more water than she normally would and the other half the normal amount of water.
It’s important to remember that in this example, there are 2 levels for one independent variable and 3 for the other. This means there are 6 conditions in total: (1) Chemical fertilizer and normal water, (2) chemical fertilizer and more water, (3) composted fertilizer and normal water, (4) composted fertilizer and more water, (5) manure and normal water, and (6) manure and more water.
Correlation
- Manipulated variables (IV): 0
- Measured variables (DV): 2
- Are we just relating stuff or are we trying to predict stuff?: Relate
Remember, we’re not using correlations to compare means. We only want to find the relationship between two continuous variables.
Example word problem:
The following (imaginary) table provides data collected regarding temperature in Fahrenheit and the number of ice creams sold from the ice cream trucks in town. Determine whether there is any sort of relationship between the two variables. Make sure to describe the strength and direction of the correlation.
Regression
- Manipulated variables (IV): 0
- Measured variables (DV): 2
- Are we just relating stuff or are we trying to predict stuff?: Predict
We can use the same data from correlations to do regressions. The difference is that there are some added steps for the purpose of predicting values using a linear equation.
Example word problem:
The following (imaginary) table provides data collected regarding temperature in Fahrenheit and the number of ice creams sold from the ice cream trucks in town. Does knowledge about temperature predict ice cream sales?