In this section, we’ll be talking about how to properly conduct a repeated measures t-test on SPSS. Before, when we were working on independent t-tests, we needed to create a list of numbers which represented group categories so that the corresponding continuous data was grouped properly. In this kind of t-test though, each “Variable” actually becomes a level. In this case of this example, we’re looking at the data from a before and after. The “Before” consists of the number of alcoholic drinks 30 college students are consuming a week. The “After” consists of the number of alcoholic drinks the same college students were drinking after having taken a Wellness class which focused on the effects of drug and alcohol on the mind and body. If you’re confused as to how this differs from an independent samples t-test, I suggest looking at the Independent Samples t-test and Repeated Measures t-test posts. 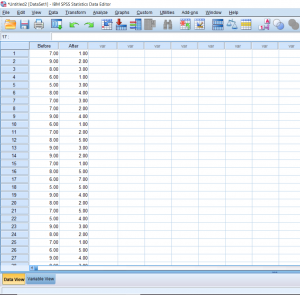
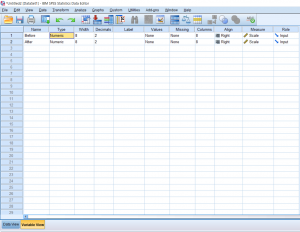
Just for reference, I have already labeled my columns Before and After in the Variable View section.
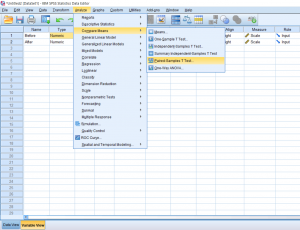
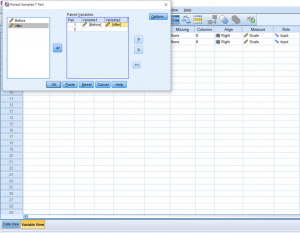
To conduct the test, click the Analyze button, hover over Compare Means, and click Paired Samples t-test.
Simply drag your before and after into the correct slots. These are usually done in chronological order from left to right.
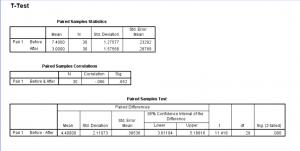
Finally, you’ll get your output. Based on this particular test, we can see that we got a t score of 11.4, which is already a pretty good indicator that the results will be significant. Typically, anything above a 3 or 4 will be significant. Just to be sure, let’s look at our p value. It’s less than 0.05, which is our typical alpha level, which means that there was a significant difference between the before and after. To see in which direction there is a difference, we go up to the means. Which one is smaller or bigger than the other? We can see that the mean drinks before the intervention was higher on average than after the intervention. In this case, we would say participants drank significantly fewer drinks per week after the intervention than before the intervention.