Basics of Variability
Variability is often a difficult topic for newcomers to statistics to grasp. Essentially it is the spread of the scores in a frequency distribution. If you have a bell curve which is pretty flat, you would say that it has high variability. If you have a bell curve which is pointy, you would say that it has low variability. Variability is really a quantitative measure of the differences between scores and describes the degree to which the score are spread out or clustered together. The purpose of measuring variability is to be able to describe the distribution and measure how well an individual score represents the distribution.
There are three main types of variability:
- Range: The distance between the lowest and the highest score in a distribution. Can be described as one number or represented by writing out the lowest and highest number together (ex. values 4-10). Calculated by subtracting the highest score from the lowest score. If you’re working with continuous variables, it’s the upper real limit for Xmax minus the lower real limit for Xmin.
- Standard deviation: The average distance between the scores in a data set and the mean. Here’s a video to help you conceptualize this. This value is also the square root of the variance.
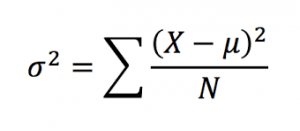
- Variance: Measures the average squared distance from the mean. This number is good for some calculations, but generally we want the standard deviation to determine how spread out a distribution is. Calculated with this equation: