Tag Archives: two-factor ANOVA

Statistics: Reading Graphs for Two-Way ANOVAs

Reading graphs of two-way ANOVAs is often a little frustrating at first for students who are new to reading them. The goal of this post is to hopefully make the process more straight-forward.

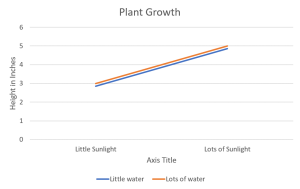
If you’re not sure already what a main effect or interaction is, I would suggest heading over to another post about two-way ANOVAs first. The purpose of one of these graphs is to help the reader visualize the results of the test when reading the results can sometimes be overwhelming, especially if the researchers are working with several different levels in each independent variable. The first trick to remember is that when looking for a significant main effect in the variable on the X-axis, we want the mean distance between the two points above one condition to be different from the mean distance between the two points of another condition. A clear example of this is below. The middle point between the orange line and blue line above “Little Sunlight” is around 2.8, while the middle point between the orange line and blue line above “Lots of Sunlight” is about 4.8. Given the context, we would say that there is a main effect for sunlight in which plant growth increases as levels of sunlight increase.

Continue reading

Statistics: Choosing a Test

The following post is about breaking down the uses for different types of tests. More importantly, it’s designed to help you know what test to use based on the question being asked. This is not a comprehensive list of all the statistical tests out there, so if you feel that there is something missing which you would like to be included, please leave a comment below. All formulas for the tests presented here can be found in the Statistics Formula Glossary post. At the bottom is a decision tree which may be helpful in visualizing the purpose of this post. Continue reading

Statistics: Two-Factor ANOVA

Introduction to Two-Factor ANOVAs

So far we’ve talked about tests which are used if there is one independent variable, either with two levels or more. This is not the limit of how much we can include in a single analysis. In a two-factor ANOVA, there is more than one independent variable and each of those variables can have two or more levels. Take this example into consideration:

A farmer wants to know the best combination of products to use to maximize her crop yield. She decides to test out three different fertilizer brands (A, B, and C) and two different kinds of seeds (Y and Z). Each product is paired once with another for a total of 6 conditions: AY, BY, CY, AZ, BZ, CZ.

A two-factor ANOVA considers more than one factor and considers the joint impact of factors. This means that instead of running a new study every time you want to see how an independent variable affects a specific dependent variable, you can run an experiment with two different independent variables and seeing how they each impact the dependent variable and you get to see if the two independent variables do anything together to affect the dependent variable. These are called main effects and interactions. Keeping the example going, if we find that no matter what the seed type is that fertilizers A, B, and C resulted in different crop yields from one another, we would say there is a main effect for fertilizer type. If no matter what the fertilizer type is there is a difference between the crop yields of seeds Y and Z, we would say that there is a main effect for seed type. If there are times that the two factors influence each other (for example, let’s say that fertilizer worked much better specifically when paired with Y seeds), we would say there’s an interaction.  The defining characteristic of an interaction is when the effect of one factor depends on the different levels of a second factor or the impact of another factor, either amplifying or reducing the effect based on the level. Continue reading