Tag Archives: SPSS

Using SPSS: Comparing Means – Independent Measures One-Way ANOVA

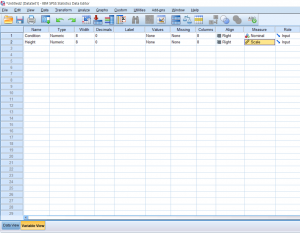
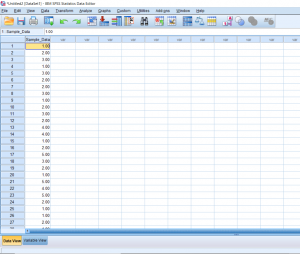
Just like an independent samples t-test, an Independent measures one-way ANOVA uses independent subjects for each level/condition within an independent variable. In this example, we’re growing plants. In Variable View, I’ve made the independent variable Condition (in this case the amount of water I’ll be giving to the plants) and the dependent variable Height.

Continue reading

Using SPSS: Comparing Means – Repeated Measures One-Way ANOVA

This post will be about finding a difference in means when it comes to repeated measures in research designs with a factor with more than 2 levels. Just like with the Repeated Measures t-test, we’ll be lining our levels up in columns. For this example, we’ll pretend that we’ve collected data on self-reported depression. Participants were asked to rate on a scale from 1-9 how severe they felt their depression is. They were then given medication to take which is known to reduce depressive symptoms. Participants were asked again after 6 months how high they rated their depression. They were asked one last time at the end of 12 months.

Continue reading

Using SPSS: Comparing Means – Repeated Measures t-test

In this section, we’ll be talking about how to properly conduct a repeated measures t-test on SPSS. Before, when we were working on independent t-tests, we needed to create a list of numbers which represented group categories so that the corresponding continuous data was grouped properly. In this kind of t-test though, each “Variable” actually becomes a level. In this case of this example, we’re looking at the data from a before and after. The “Before” consists of the number of alcoholic drinks 30 college students are consuming a week.  The “After” consists of the number of alcoholic drinks the same college students were drinking after having taken a Wellness class which focused on the effects of drug and alcohol on the mind and body. If you’re confused as to how this differs from an independent samples t-test, I suggest looking at the Independent Samples t-test and Repeated Measures t-test posts.  Continue reading

Using SPSS: Comparing means – Independent Samples t-test

So far we’ve talked about creating independent variables, but what about levels? This may seem strange at first, but levels of a condition need to be spelled out by numbers. Usually, I just assign condition 1 a 1 and condition 2 a 2. You can see in the picture below how this looks. You can’t see this, but there are 30 individuals in total, half in condition 1, and half in condition 2.

Continue reading

Using SPSS: Descriptive Statistics

Sometimes you’ll want to get some basic information on the data you have. Running these descriptive statistics is pretty straight forward. First, click the Analyze button, hover over the Descriptive Statistics tab, and then you’ll be able to choose a few different options. I prefer just clicking the frequencies button because it gives you the option to look at frequencies as well as other kinds of descriptives.

Continue reading

Using SPSS: Using Data and Variable View

When getting started with SPSS, you may initially be confused about how to input your data in such a way that it’s easy to read and will allow you do to do the analyses that you would like to do.

When first opening a new dataset on SPSS, you will be greeted with this blank screen on the Data View tab.

Continue reading