Author Archives: Jenna Lehmann

Using SPSS: Comparing Means – Repeated Measures One-Way ANOVA

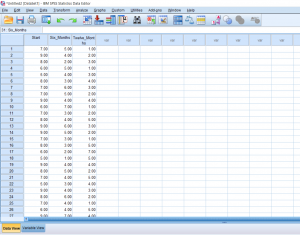
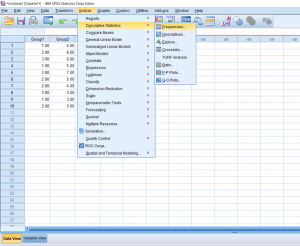
This post will be about finding a difference in means when it comes to repeated measures in research designs with a factor with more than 2 levels. Just like with the Repeated Measures t-test, we’ll be lining our levels up in columns. For this example, we’ll pretend that we’ve collected data on self-reported depression. Participants were asked to rate on a scale from 1-9 how severe they felt their depression is. They were then given medication to take which is known to reduce depressive symptoms. Participants were asked again after 6 months how high they rated their depression. They were asked one last time at the end of 12 months.

Continue reading

Using SPSS: Comparing Means – Repeated Measures t-test

In this section, we’ll be talking about how to properly conduct a repeated measures t-test on SPSS. Before, when we were working on independent t-tests, we needed to create a list of numbers which represented group categories so that the corresponding continuous data was grouped properly. In this kind of t-test though, each “Variable” actually becomes a level. In this case of this example, we’re looking at the data from a before and after. The “Before” consists of the number of alcoholic drinks 30 college students are consuming a week.  The “After” consists of the number of alcoholic drinks the same college students were drinking after having taken a Wellness class which focused on the effects of drug and alcohol on the mind and body. If you’re confused as to how this differs from an independent samples t-test, I suggest looking at the Independent Samples t-test and Repeated Measures t-test posts.  Continue reading

Using SPSS: Comparing means – Independent Samples t-test

So far we’ve talked about creating independent variables, but what about levels? This may seem strange at first, but levels of a condition need to be spelled out by numbers. Usually, I just assign condition 1 a 1 and condition 2 a 2. You can see in the picture below how this looks. You can’t see this, but there are 30 individuals in total, half in condition 1, and half in condition 2.

Continue reading

Using SPSS: Descriptive Statistics

Sometimes you’ll want to get some basic information on the data you have. Running these descriptive statistics is pretty straight forward. First, click the Analyze button, hover over the Descriptive Statistics tab, and then you’ll be able to choose a few different options. I prefer just clicking the frequencies button because it gives you the option to look at frequencies as well as other kinds of descriptives.

Continue reading

Using SPSS: Using Data and Variable View

When getting started with SPSS, you may initially be confused about how to input your data in such a way that it’s easy to read and will allow you do to do the analyses that you would like to do.

When first opening a new dataset on SPSS, you will be greeted with this blank screen on the Data View tab.

Continue reading

Statistics: Choosing a Test

The following post is about breaking down the uses for different types of tests. More importantly, it’s designed to help you know what test to use based on the question being asked. This is not a comprehensive list of all the statistical tests out there, so if you feel that there is something missing which you would like to be included, please leave a comment below. All formulas for the tests presented here can be found in the Statistics Formula Glossary post. At the bottom is a decision tree which may be helpful in visualizing the purpose of this post. Continue reading

Statistics Formula Glossary

Stats Formula Glossary (Word) as of 7/16/2019

Stats Formula Glossary (PDF) as of 7/16/2019

Attached to this post are a PDF version and a Word document version of a glossary of formulas that may be helpful to keep around when practicing statistical problems for homework or studying for an upcoming test.

Please keep in mind that although these formulas work, they may not be the versions that your professors have taught you to use. It may also be that this formula sheet has formulas for problems you don’t need to know how to solve for the purposes of your class. If this is the case, we encourage you to download the Word document version so that you may add to, subtract from, or edit the glossary to fit your own individual needs.

Please keep in mind that this formula sheet may be edited after having been posted; the copy you download today may be different from the copy posted tomorrow. This list is by no means comprehensive of all formulas used in the field of statistics. If you have suggestions on formulas you would like to see added to this list, please leave a comment underneath of this post and we will take your suggestion into consideration. Good luck!

Statistics: Regression

Introduction to Linear Regression

Linear regression is a method for determining the best-fitting line through a set of data. In a lot of ways, it’s similar to a correlation since things like r and r squared are still used. The one difference is that the purpose of regression is prediction. The best-fitting line is calculated through the minimization of total squared error between the data points and the line.

The equation used for regression is Y = a +bx or some variation of that. If you remember from algebra class, this formula is like Y=mx+b. This is because they are both the linear equation. Although you may be asked to report r and r squared, the purpose of regression is to be able to find values for the slope (b) and the y-intercept (a) that creates a line that best fits through the data. Continue reading

Statistics: Correlation

Introduction to Correlation and Regression

So far we’ve been talking about analyses which involve variables which are split up into categorical or discrete variables (ex. treatment A, B, C) compared to a dependent variable which is continuous (ex. plant height). However, there is a way to look at two variables which have continuous data: correlation. A correlation will tell you the characteristics of a relationship such as direction (either positive or negative), form (we often work with linear relationships), and strength of the relationship. Strength and direction can be understood with the number which is given at the end of an analysis (r).

positive correlation is one in which the increased value of one variable results in the increased value of another. For example, height and weight – as height increased, weight also tends to increase. A negative correlation is one in which the increased value of one variable results in the decrease of another. For example, as the temperature outside increases, hot chocolate sales will decrease. This is what is meant by the direction of a correlation. An r-value with a negative sign in front of it means a negative correlation and one without a negative sign means a positive correlation. Continue reading