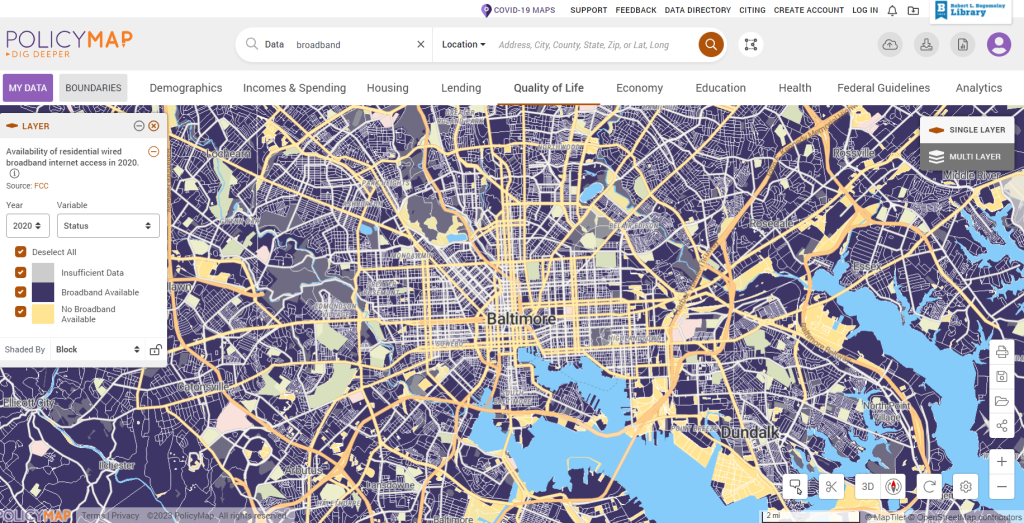
Do you wish you could create a map using data from different sources, including your own data? Well, the RLB Library has available a resource called PolicyMap, a state-of-the-art mapping platform with access to a vast geographic data warehouse. Through maps, you can display visual and spatial information in your reports, projects, and presentations.
With PolicyMap, you can access tens of thousands of datasets, eliminating the need to find and standardize data from disparate sources. You can also upload your own data points to the platform. Applications include:
- Identify inequities, track disease outbreaks, and plan public health interventions using social determinants of health
- Pinpoint disaster-prone areas and plan emergency response strategies
- Understand how policy interventions affect communities in need and identify social, economic, and health disparities
- Analyze the distribution of environmental hazards, such as areas of high lead exposure and toxic waste, and understand their impact on public health and the environment
- Identify areas where transportation, computer, and internet access can improve access to jobs, education, and other opportunities
- Understand the changing aspects of housing markets and the challenges of affordability, segregation, and equity that can arise in different geographic areas
What’s new on PolicyMap (4/2024):
- 2018-2022 ACS (American Community Survey) data has been published that includes variables such as total population, race (including both the total count of each race category and the count of non-Hispanic people of each race category), group quarters, and total housing units.
- Access local health data with CDC PLACES. These layers allow users to understand the distribution and frequency of 30+ chronic conditions, risk behaviors, health statuses, and prevention methods in 2021. Several examples of indicators include heart disease, cancer, diabetes, depression, binge drinking, smoking, health insurance enrollment, and frequency of medical checkups. Every CDC PLACES indicator is available at the City, County, Zip Code Tabulation Area (ZCTA) and Census Tract level.
- New data showing locations of hospitals and nonprofits
Includes:
- The Diversity Index, plus Predominant Race/Ethnicity Data
- Racial Housing Disparity data
- Home Sale data (zip code level)
- Area Fair Market Rent (FMR)
- IRS Migration data
- The Area Deprivation Index from the University of Wisconsin
- CDC PLACES data
- Health Professional Shortage Areas (HPSA)
- High School Graduation Rates from the National Center for Education Statistics (NCES)
- Premium datasets including Consumer Spending Habits, Medical Spending Estimates, Chronic Health Conditions, Risk Factors Related to Health, Home Sale data at the Zip Code level, Broadband Availability at the census block level, Home Ownership and Rental Affordability Estimates, Mortgage Loan and Mortgage Loan Denials, Opportunity Zone Resources and more.
Additional features include a citation generator— this new tool enables you to easily cite PolicyMap as the source for your research. You can choose from APA, Chicago, MLA, or AMA Style.
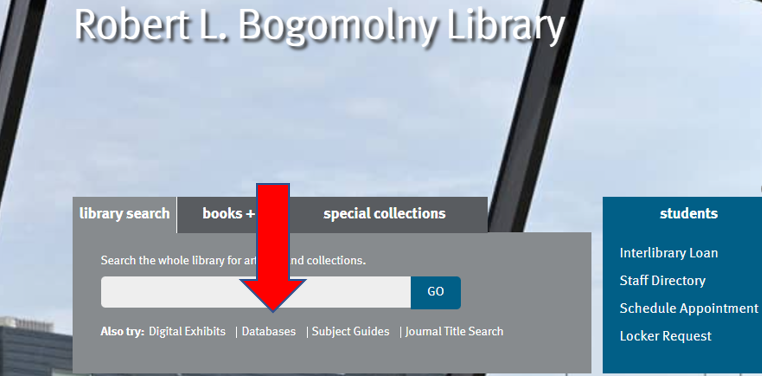
How do you find PolicyMap on the library website? Click on “Databases” under the library search box and look under “P” in the A-Z list of databases for PolicyMap.

Want to learn more? PolicyMap has a Quick Start guide or check out tutorials on the PolicyMap Tutorial page.
Questions? Contact Debbie Li, dli@ubalt.edu.